Sign in
Services
Professional services
Core Home Theater Design
Complete Home Theater Design
Core Listening Room Design
Core Home Recording Studio Design
Acoustic Analysis & Treatment Design
Q&A Services
All Services
Solutions
Home Theater
High-End Audio
Home Recording Studio
Resources
Case Studies
Portfolio
Industry Partners
Products
Products By Category
Acoustic Treatment
Home Theater Amplifiers
Home Theater AV Receivers
Home Theater Preamp Processors
Home Theater Projection Screens
Home Theater Projectors
Home Theater Sources
Home Theater Speakers
Home Theater Subwoofers
Featured Brands
Harbottle Audio
Trinnov
ATC Loudspeakers
Environmental Potentials
Exclusive Products
Wave Diffuser
Polyester Absorber
HYPERSUB
Blog
About
Cart
Search
Search
Services
+
Professional services
+
Core Home Theater Design
Complete Home Theater Design
Core Listening Room Design
Core Home Recording Studio Design
Acoustic Analysis & Treatment Design
Q&A Services
All Services
Solutions
+
Home Theater
High-End Audio
Home Recording Studio
Resources
+
Case Studies
Portfolio
Industry Partners
Products
+
Products By Category
+
Acoustic Treatment
Home Theater Amplifiers
Home Theater AV Receivers
Home Theater Preamp Processors
Home Theater Projection Screens
Home Theater Projectors
Home Theater Sources
Home Theater Speakers
Home Theater Subwoofers
Featured Brands
+
Harbottle Audio
Trinnov
ATC Loudspeakers
Environmental Potentials
Exclusive Products
+
Wave Diffuser
Polyester Absorber
HYPERSUB
Blog
About
Sign in
Shop by Category
Absorbers
Absorbers
ACOUSTIC ANALYSIS & TREATMENT DESIGN PACKAGE
Acoustic Treatment
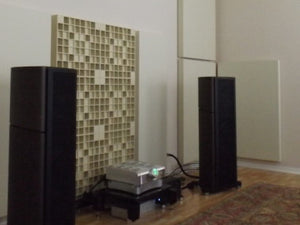
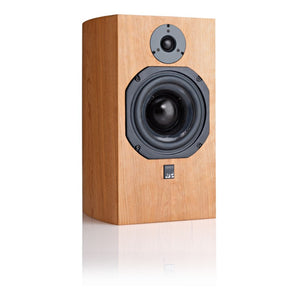
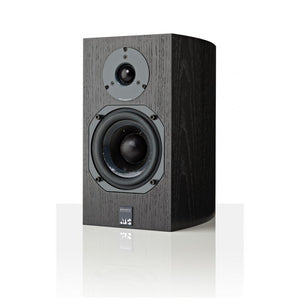
ATC
We’ve been exposed to a lot of speakers through our acoustic consulting work and very few brands have impressed us like ATC. They’re the speaker of choice for artists such as Pink Floyd, Mark Knopf...
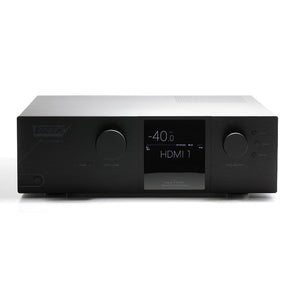
AudioControl
Hailing from the Pacific Northwest, AudioControl make the best sounding AVRs - and some of the best sounding power amplifiers - on the market. Their AVRs are assembled in the US, offer a 5 year war...
Auralex
Acoustic treatment manufacturer with some useful products that we use on a regular basis. Foam has it's detractors, but it's a useful product for specific applications, such as isolation and low-co...
AVRs / Pre-Pros
Bass Traps
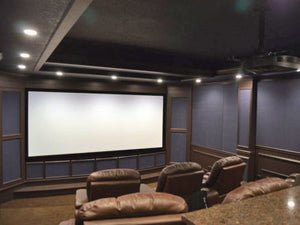
COMPLETE HOME THEATER DESIGN PACKAGE
We know how overwhelming all the details and nuances of home theater design can be. This package includes everything you need to experience home theater like never before! Request a quote today.
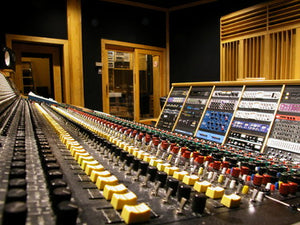
CORE HOME RECORDING STUDIO DESIGN PACKAGE
If You’re Building A Home Recording Studio, This Is The Package For You And Includes Everything You Need To Create Music Like Never Before!
CORE HOME THEATER DESIGN PACKAGE
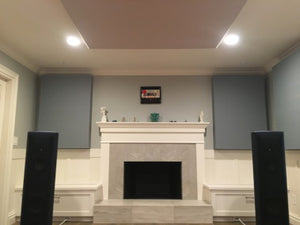
CORE LISTENING ROOM DESIGN PACKAGE
If You’re Building A Listening Room, This Is The Package For You And Includes Everything You Need To Experience Music Like Never Before!
Datasat
Reference class home theater pre-processors with superb audio quality and the best room correction system on the market - Dirac Live. If you want to turn your home theater into something approachin...
DEQX
Australian manufacturer of digital pre-amplifiers with extensive digital signal processing capabilities including crossover, delay, level, proprietary linear phase speaker correction and parametric...
Diffusers
Digital Signal Processors
Environmental Potentials
Clean electricity is the foundation for a high performance audio / video system. Environmental Potentials, whilst not name familiar to most enthusiasts, are the manufacturer whose products you need...
FEATURED PRODUCTS
At Acoustic Frontiers, we're always seeking best-in-class products.
High-End Audio Equipment
Home Theater Acoustics
Blah blah.
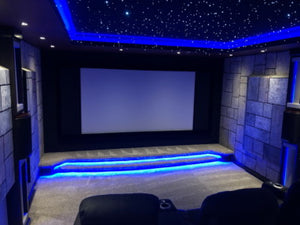
Home Theater Design Services
Acoustic Frontiers creates home theaters that match or transcend the quality of commercial cinemas. We provide turnkey home theaters, as well as consulting services to audio/video enthusiasts and c...
Home Theater Equipment
Blah blah
Hybrid Absorber / Diffusers
Installation Hardware
Jensen Transformers
A specialist manufacturer of signal isolation transformers, Jensen Transformers offer the widest frequency responses and lowest distortion out there. In a properly designed system you shouldn't nee...
JL Audio
In our opinion the best subs for music in the world. Maybe not the last world in value, or output, but JL offer a blend of features, form factor and sound quality that is addictive. Cabinets are sm...
JVC
Projectors with class leading black levels, enough light output for large acoustically transparent screens and lens motorization for constant image height / constant image width projection. Whilst ...
OUR OTHER SERVICES
Our Services
OUR SERVICES
OUR TOP SERVICES
Parasound
Designed and engineered in San Francisco, Parasound offer superb sounding power amplification. These include the long running Halo series, comprised high-current amplifiers with exceptional sound q...
Power Conditioners
Power Sound Audio PRO
We've partnered with these masters of subwoofer design to design and engineer a unique - and exclusive - high output, shallow form factor subwoofer system for our custom home theaters. Power Sound...
Procella
Speakers expressly designed for high performance home theater - high power handling, slim form factor, sealed boxes with solid sound quality. Procella Audio are our step-up manufacturer for our ent...
Reference Class Home Theater
Seymour AV
High value, made-in-US projection screens, including the world's only acoustically transparent retractable with velvet borders. Their XD material is our go-to home theater projection screen materia...
Signal Isolation Transformers
Sony
Projector solutions from entry level to reference level, all of which create an exceptionally natural and color accurate image free of digital processing nasties. Plenty of light output for large a...
Speakers
Subwoofers
Torus Power
Canadian manufacturer of toroidial isolation transformers. Torus Power started out as a side venture for Plitron, one of the foremost magnetics manufacturers in the world. They've applied their kno...
Trinnov
Three dimensional innovation in audio. Trinnov's unique audio processing technologies include 3D speaker remapping, IIR / FIR room correction and software based surround sound decoding. The only so...
Xilica
Designed and engineered in Canada, Xilica's DSP processors provides a comprehensive set of digital signal processing (DSP) functionality based on 24 bit / 96Hz converters and 40 bit floating point ...
Contact Us About This Product
Nyal Mellor, Founder, Acoustic Frontiers
(415) 524-8741
Serving USA & Canada
Fairfax, Northern California, USA
ask us a question about this product